Liquidity Heatmap
Find resting liquidity zones around current price and see which levels may attract or block the next move.
Open the full market map for free, without registration. Read liquidity, order flow, CVD, liquidations, whale activity, funding context and key levels in one clean view.
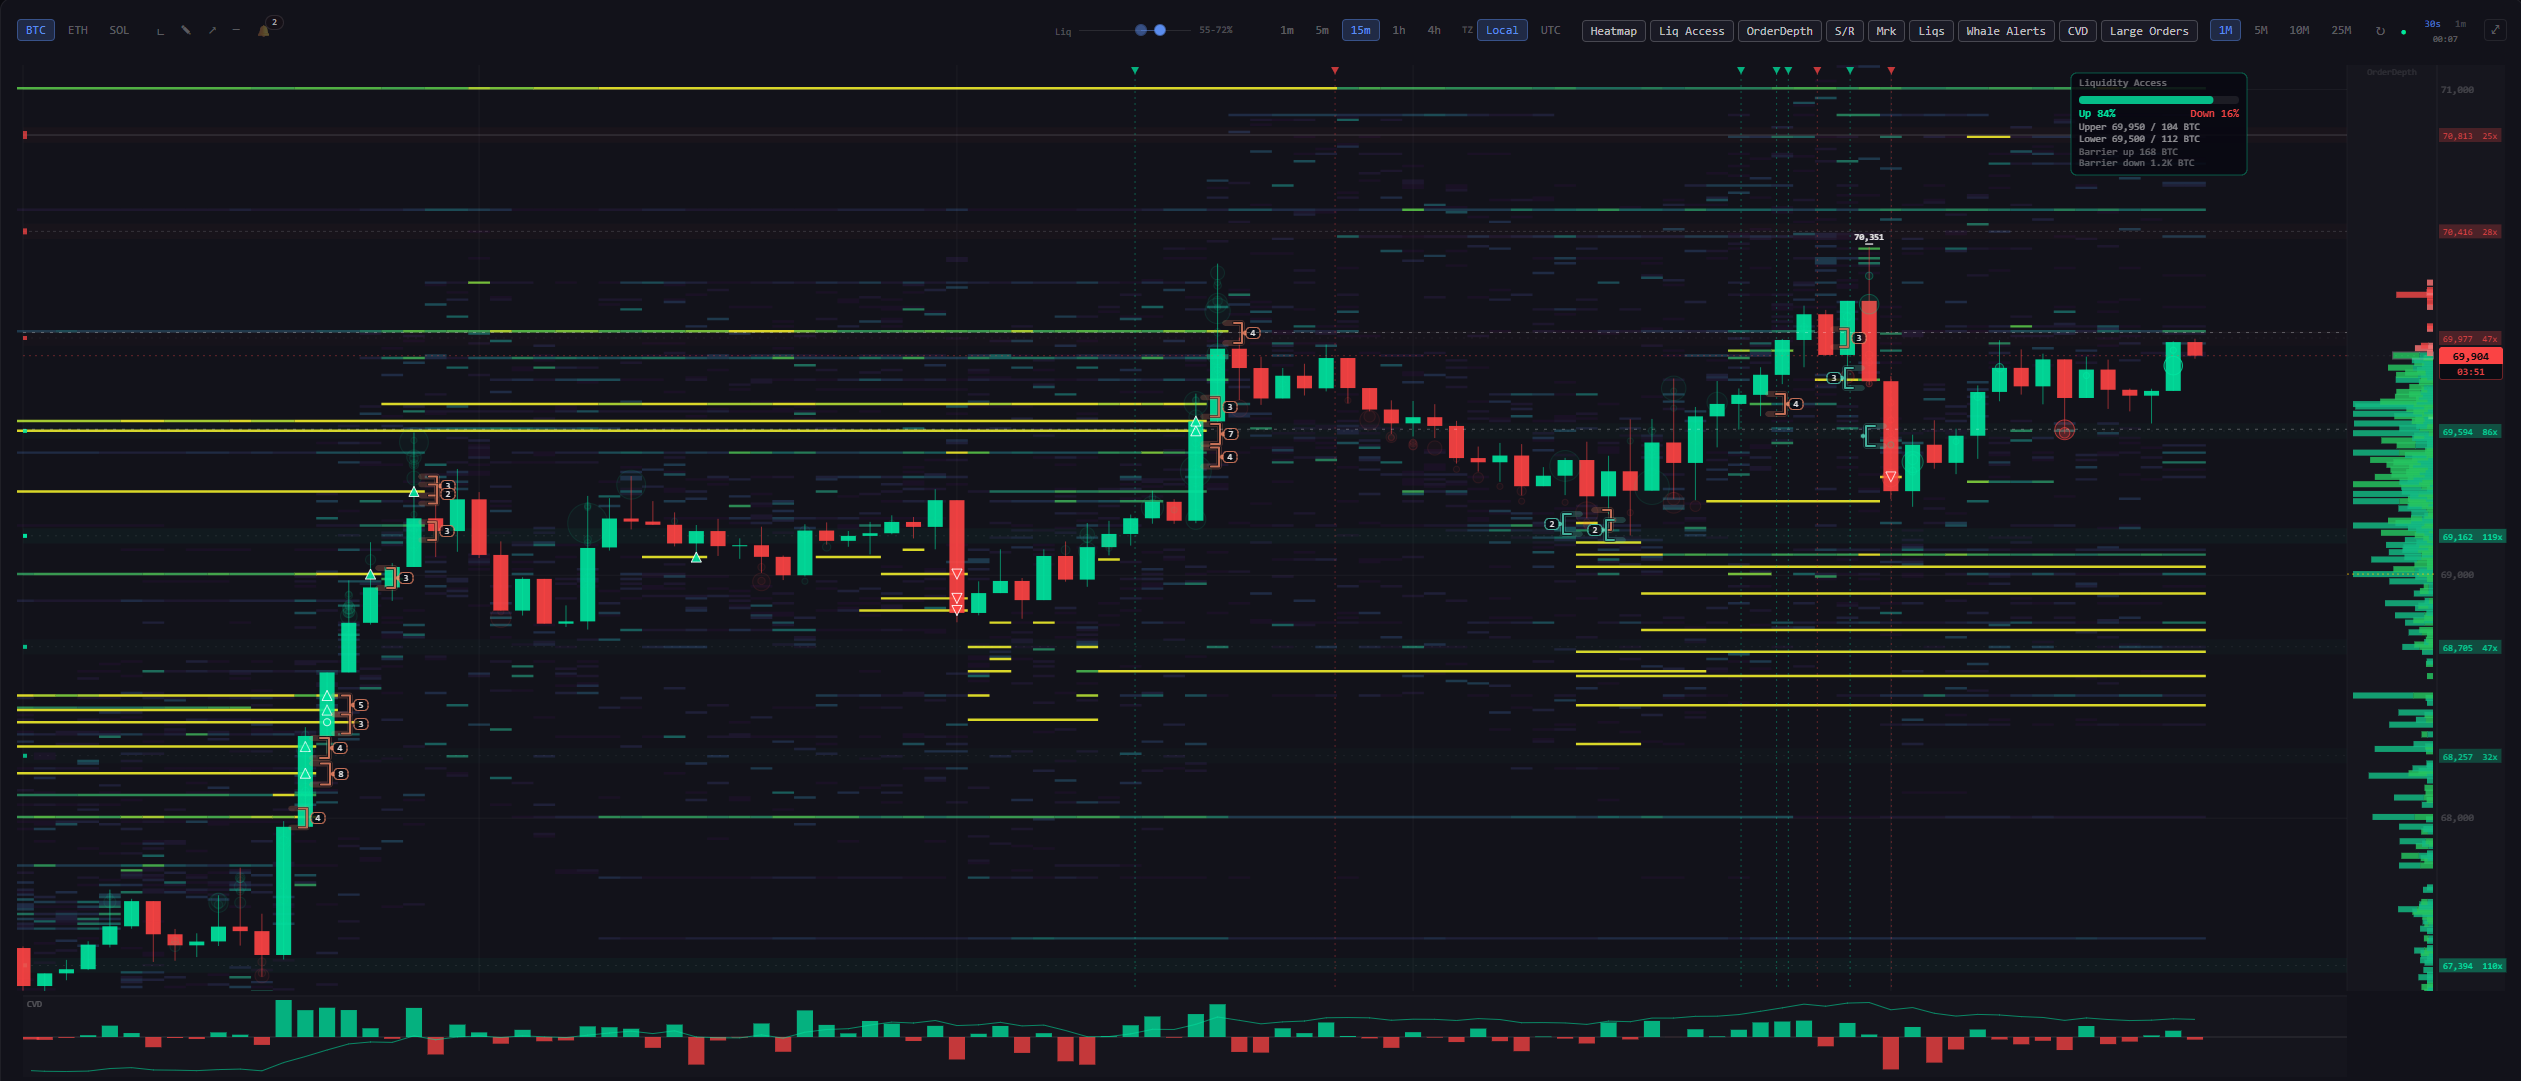
Market context
Find resting liquidity zones around current price and see which levels may attract or block the next move.
Check whether a move is backed by aggressive buyers or sellers instead of relying on candles alone.
Spot forced unwinds, squeeze zones and cascade risk directly on the price chart before the move is over.
Follow large transfers and outsized market trades from major venues without leaving the main chart.
Keep important reaction levels on screen without turning the dashboard into a crowded terminal.
Create alerts for market conditions and get notified in the browser or on your phone when they are met.
Direct answer
EdgeMap is a free crypto market-structure dashboard for active futures traders. It combines liquidity heatmaps, order flow, CVD, liquidation zones, whale activity and key levels in one view, and the full market map can be opened without registration.
Resting liquidity, aggressive trades, liquidation events, large transfers, alerts and key levels are shown in the same price context.
The dashboard focuses on crypto traders and also supports selected commodities/metals where fewer crypto-native tools provide clear context.
EdgeMap helps traders decide what to inspect before a trade. It does not provide financial advice, automated buy/sell calls or guaranteed outcomes.
FAQ
EdgeMap shows liquidity heatmaps, OrderDepth, order flow, CVD, liquidations, whale transfers, large market orders, support/resistance, funding, market overview context and smart alerts.
EdgeMap is for intraday, scalp and swing crypto traders who understand liquidity, liquidations and order flow, but want the context in one cleaner workflow.
The full EdgeMap market dashboard is free to use without registration. Optional subscriptions support independent development and do not unlock additional market layers.
EdgeMap is positioned as a lighter web dashboard for pre-entry context, not a broad data portal, complex pro terminal or signal bot.
No. EdgeMap is decision-support software and does not provide financial advice, automated trade signals or guaranteed outcomes.
Open the full map for free and check liquidity, flow and risk zones before your next trade. No registration required.